Demand, meet Supply
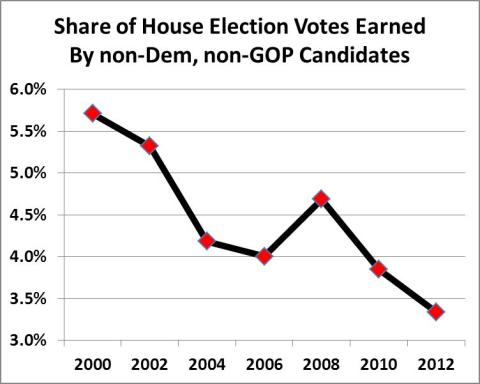
Amidst some disenchantment with both major political parties, the chart above shows, when looking across the 50 states, the share of votes earned by candidates that were not either Democratic or Republican has fallen significantly for U.S. House of Representative elections since 2000.
 The State Data Lab resource (Votes Cast for House Election – Other), developed by Truth in Accounting, shows that states with relatively high shares of non-major party votes in 2000 also had some of the greatest declines. The average share of non-major-party votes in the 5 states with the highest non-Dem and non-GOP shares in 2000 (Alaska, Massachusetts, New York, Rhode Island and Vermont) fell from 28% to 7% over that time frame. In those states, the shift was clearly associated with rising fortunes for Democratic candidates.
Roughly one-fifth of the states showed a rising trend in non-major-party candidate share of total vote, however. These states were Arizona, Arkansas, Connecticut, Florida, Illinois, Maryland, Michigan, Missouri, Montana, New Hampshire, Tennessee, and Wyoming.
Truth in Accounting would appreciate feedback on new ideas for data and other resources independent voters would like to see on State Data Lab.
